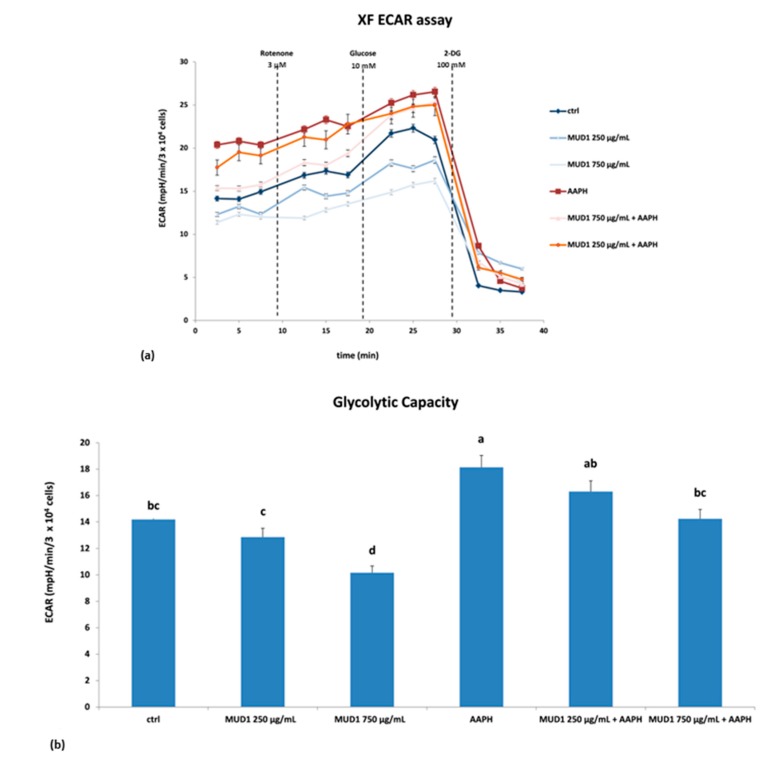
Figure 6.
Extracellular acidification rate (ECAR) (a) and glycolytic capacity (b) in HDF cells treated with different concentrations of MUD1 (250–750 μg/mL) for 24 h, AAPH (10 mM) for 24 h and with different concentrations of MUD1 and then with AAPH. Data are expressed as mean values ± SD. Columns belonging to the same set of data with different superscript letters are significantly different (p < 0.05).

