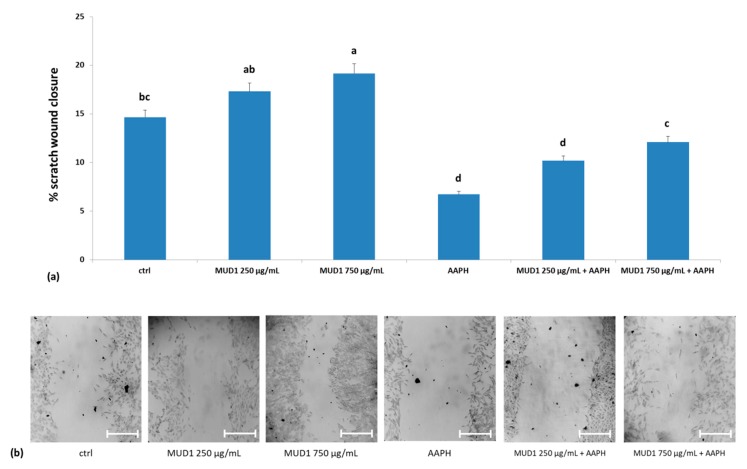
Figure 7.
Scratch wound closure (a) in HDF cells treated with different concentrations of MUD1 (250–750 μg/mL) for 24 h or AAPH (10 mM) for 24 h and with different concentrations of MUD1 and then with AAPH. Data are expressed as mean values ± SD. Columns with different superscript letters are significantly different (p < 0.05). Representative images illustrating the migration of HDF cells into the scratch wound during different treatments exposure (b). Scale bars = 100 µm

