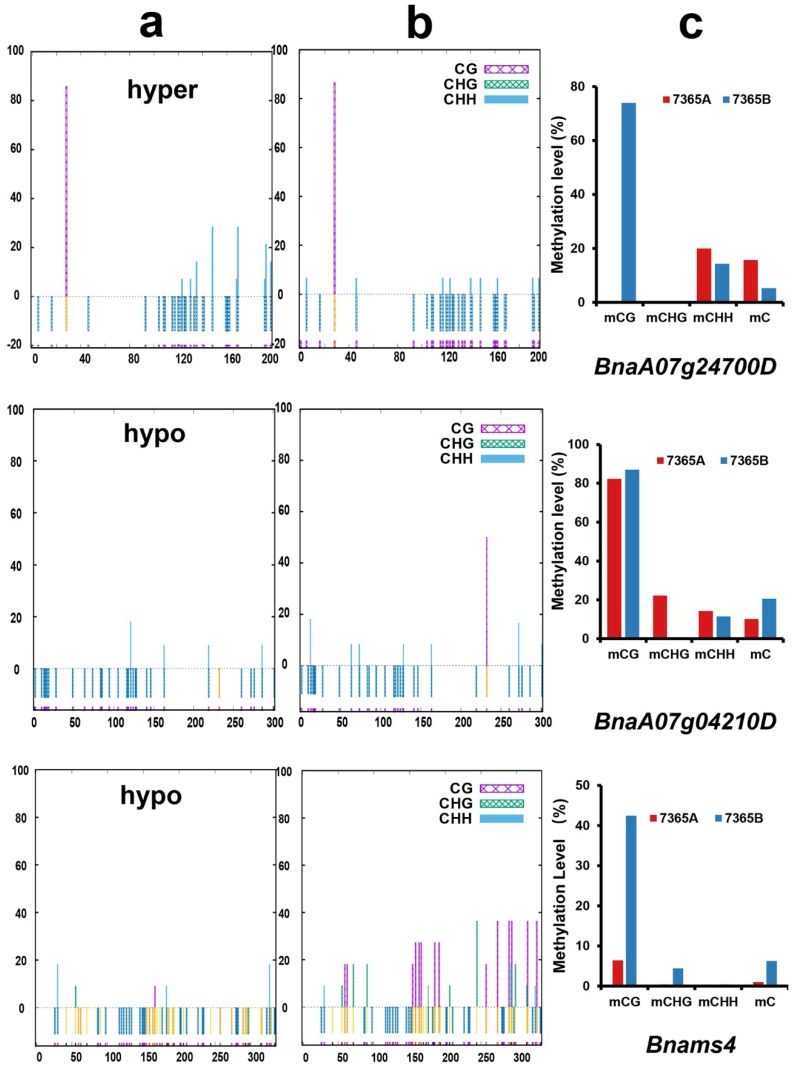
Figure 7.
DNA methylation at specific sites of two DMGs and Bnams4 by traditional bisulfite sequencing. (a) Bisulfite PCR results in 7165A; (b) Bisulfite PCR results in 7365B. The vertical axis represents the percentage of methylated sites; the horizontal axis represents the position of cytosine in the DMRs; hypo and hyper represents hypo-methylated and hyper-methylated DMR in 7365A. (c) WGBS results of the corresponding DMR.

