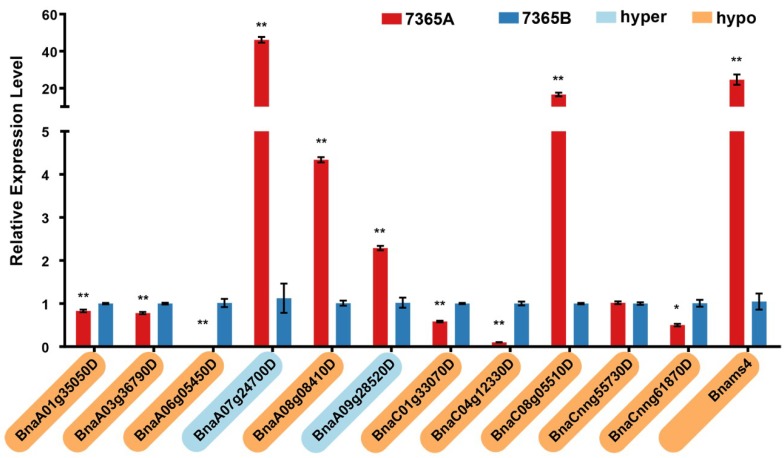
Figure 8.
Expression analysis of pollen development-related DMGs and Bnams4. The asterisk indicates a significant difference between 7365A and 7365B (*: p-value < 0.05, **: p-value < 0.01). The Gene ID highlighted in yellow and blue on the vertical axis represents hyper-methylated and hypo-methylated DMRs.

