
Figure 4.
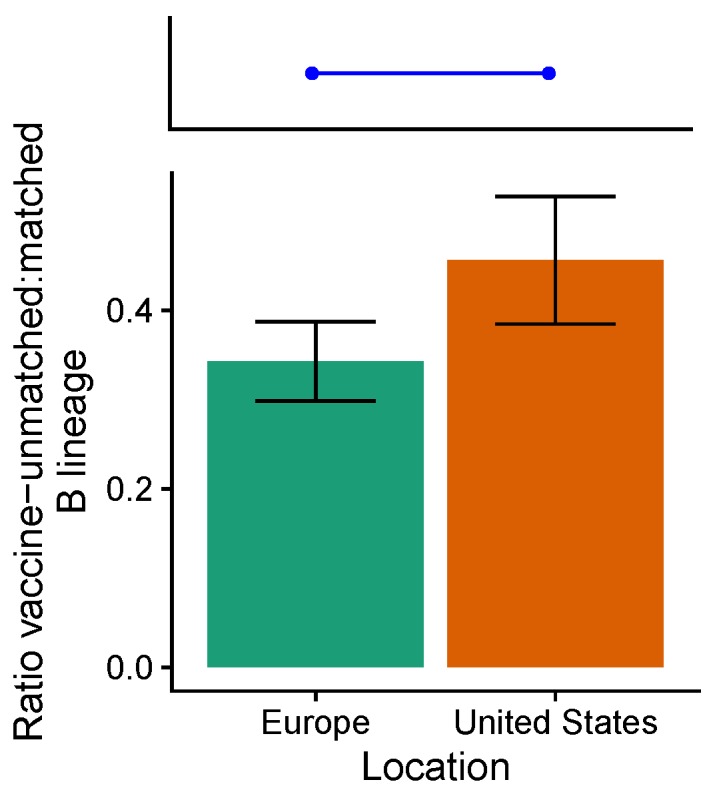
The ratios of vaccine-unmatched to matched B lineages differ marginally between the United States and Europe from the 2009–2010 to the 2012–2013 seasons (). The blue line and points show the expectation of no spatial difference in lineage ratios under the assumption that VE does not differ between lineages. Error bars indicate 95% binomial confidence intervals. Unweighted seasonal lineage frequencies are shown in Figure A15.