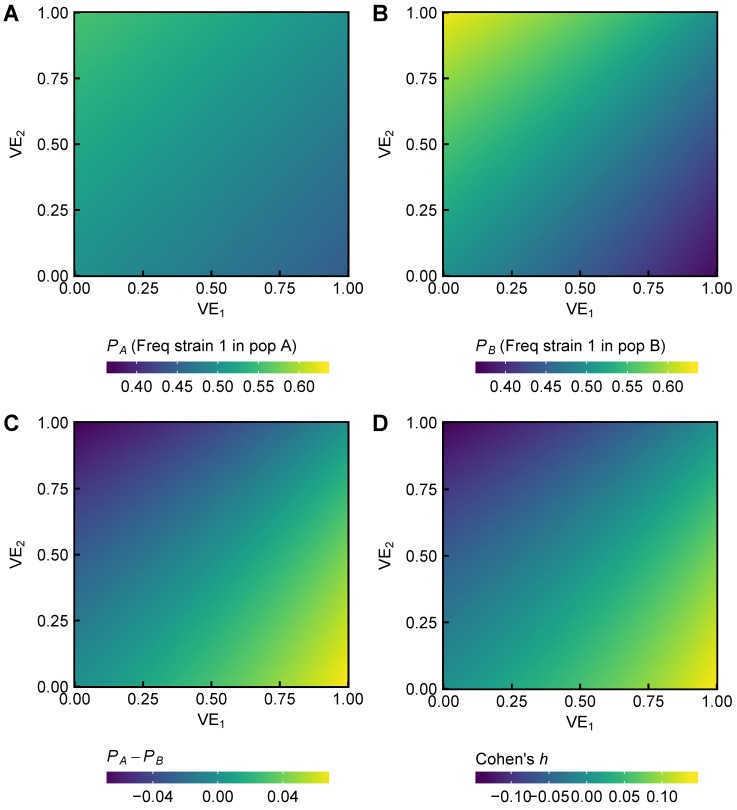
Figure A11.
Simulated frequencies of two strains and , circulating in populations A (with 20% vaccine coverage) and B with (40% vaccine coverage), calculated according to Equation (A23). Given the vaccine effectiveness against both strains, we calculated the fraction of strain 1 (out of strains 1 and 2) in (A) population A and (B) population B. The absolute difference in frequencies between regions is shown in (C), and the Cohen’s h effect size is shown in (D). These quantities are used to calculate statistical power in Figure A12.

