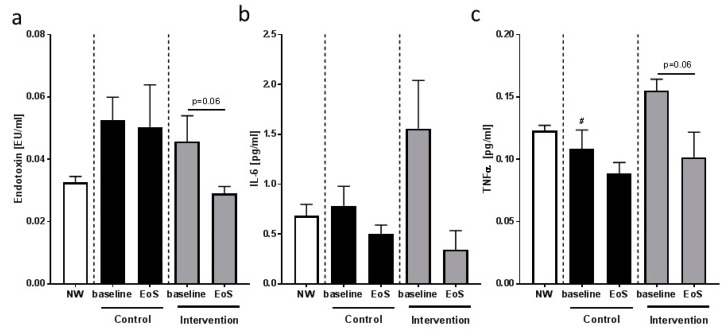
Figure 4.
(a) Plasma endotoxin, (b) serum IL-6, and (c) plasma TNFα concentrations of children with NAFLD enrolled in the control (Control) and intervention (Intervention) group at baseline (baseline) and at the end of the study (EoS). Data are means ± SEM; # p < 0.05 values at baseline between both groups; NW children were not included in the statistical analysis, but are shown for comparison. Underreporters were excluded from the analysis.

