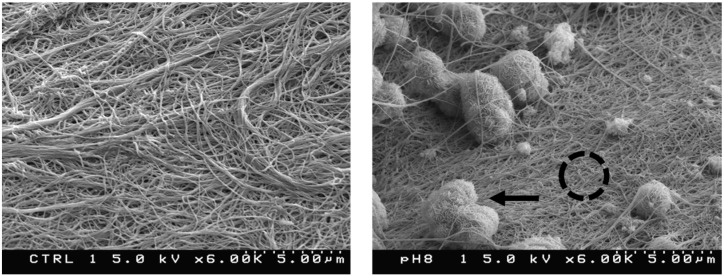
Figure 3.
Scanning electron micrographs of our collagen gels before (left) and after (right) mineralization. Average fibril diameters show a mean of 75 ± 21 nm (N = 70). After mineralization, micron size aggregates are visibly trapped in the gel (indicated by arrow in right panel). Energy dispersive X-ray analysis (EDX) shows Ca and P in a ratio of ~1.8 present in these aggregates. On regions of the surface with no apparent aggregates (ex. inside the dashed circle near the middle of the right panel), EDX shows Ca/P ≅ 1.4.

