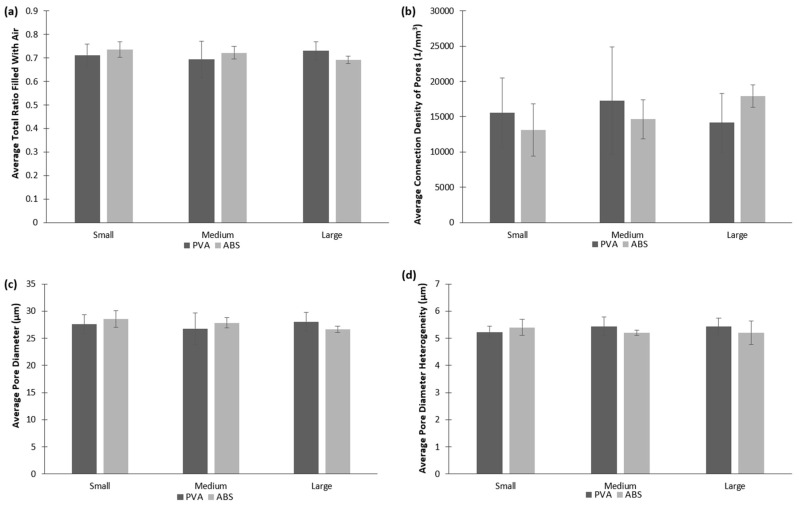
Figure 5.
µCT scans provide quantifiable data for the cryogels’ pore sizes and interconnectivity. (a) represents the average ratio of air to scaffold; (b) represents the average connection density of the cryogels’ pores; (c) represents the average pore diameter; and (d) represents the average pore diameter heterogeneity.

