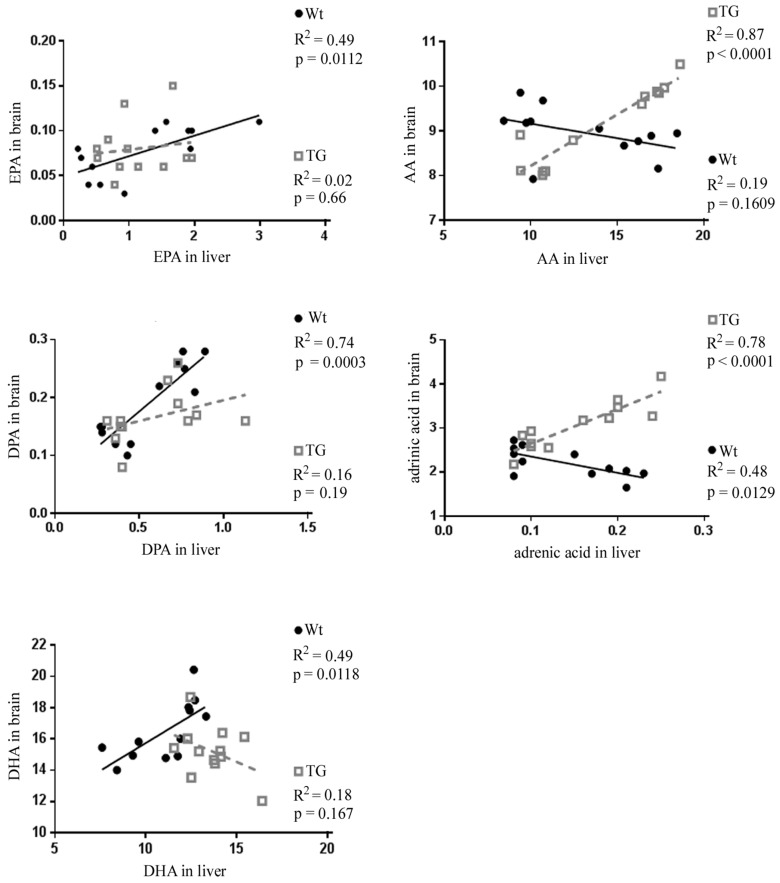
Figure 3.
Relationship between the liver and the brain omega-3 and omega-6 fatty acids. Linear regression analysis of EPA, DPA, DHA, AA and adrenic acid levels (percentage of total fatty acids) between the liver and the brain of Wt (black circles) and TG, 5xFAD mice (gray squares). Significant correlation was found for individual n-3 fatty acids in Wt animals and for n-6 fatty acids in 5xFAD animals.

