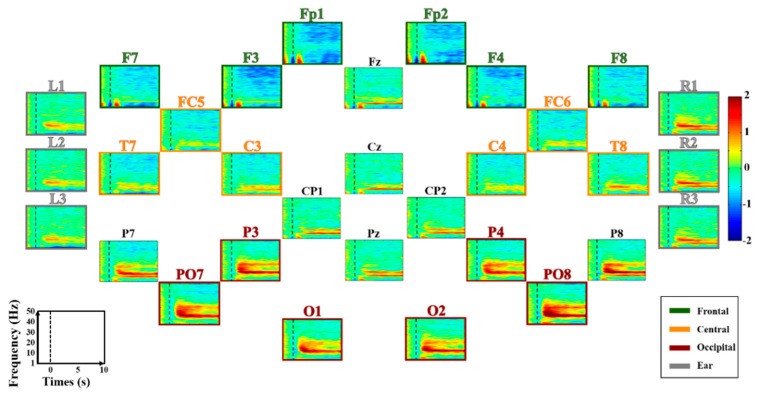
Figure 4.
Grand average ERD/ERS maps of all electrodes during MA. The four regions of interest (ROIs), frontal, central, occipital, and ear area, are denoted by four different colored lines and titles for each map (green, orange, red, and gray), respectively. The x- and y-axis of each map indicate the task time from −2–10 s based on task onset (t = 0 s), and the frequency band ranging from 1 to 50 Hz, respectively. ERD and ERS are presented in blue and red, respectively. Note that scalp- and ear-EEG are independently re-referenced using a CAR and a modified CAR, respectively.

