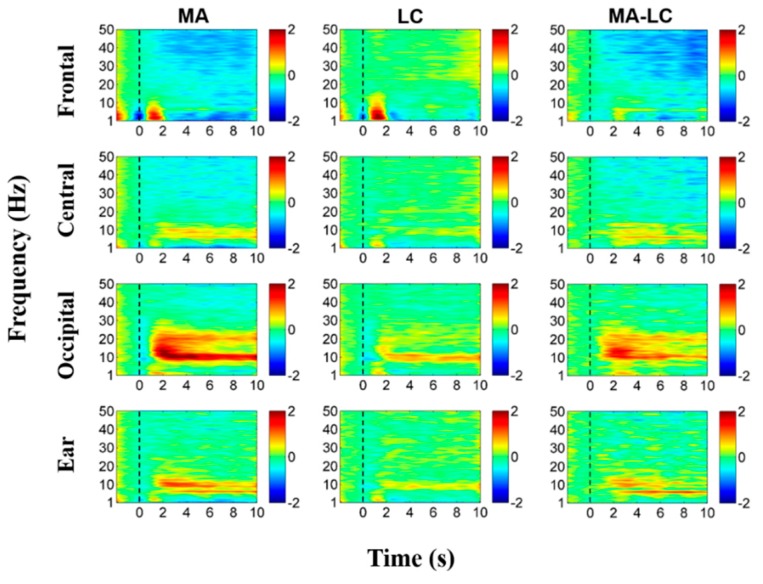
Figure 6.
Grand average ERD/ERS maps of each ROI during MA and LC, and their differences (MA-LC). The ERD/ERS maps of ear area (denoted by ‘Ear’) are obtained by averaging the six electrodes attached behind both ears (three electrode for each side). The x- and y-axis of each map indicate the task time from −2–10 s based on task onset (t = 0 s), and the frequency band ranging from 1 to 50 Hz, respectively. ERD and ERS are presented in blue and red, respectively.

