Figure 5.
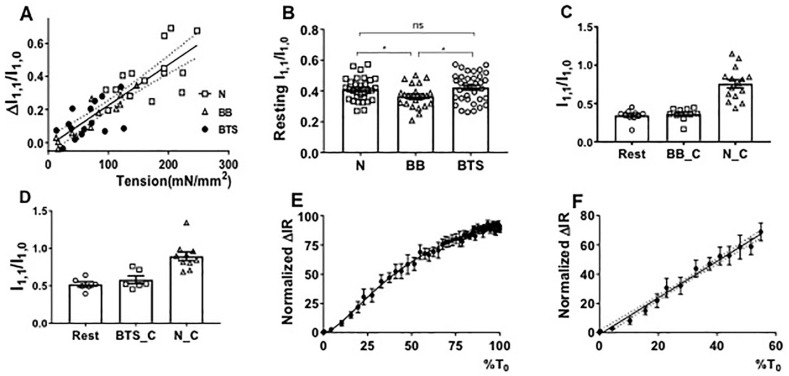
Equatorial intensities in active and resting mouse EDL muscle. (A) The change in I1,1/I1,0 (ΔI1,1/I1,0), has a linear relationship with the tension generated by blebbistatin-treated (BB), BTS-treated (BTS), and normal contracting muscle (N). (B) I1,1/I1,0 in resting normal muscle (from Figure 3B), blebbistatin-treated (BB), and BTS-treated muscle. ns: p ≥ 0.05, *: p < 0.05. (C) Intensity ratio changes from resting to contracting conditions at maximum inhibited (less than 10% of normal contraction tensions) by BB as compared to normal contracting (N_C). (D) Intensity ratio changes from resting to contracting conditions at maximum inhibited (less than 10% of normal contraction tensions) by BTS as compared to normal contracting (N_C). (E) ΔI1,1/I1,0 (ΔIR) as a percent of its maximal value, as a function of normalized tension during tension rise after stimulation in tetanically contracting muscle in the absence of inhibitors. (F) As C, but showing linear behavior at low tension values.

