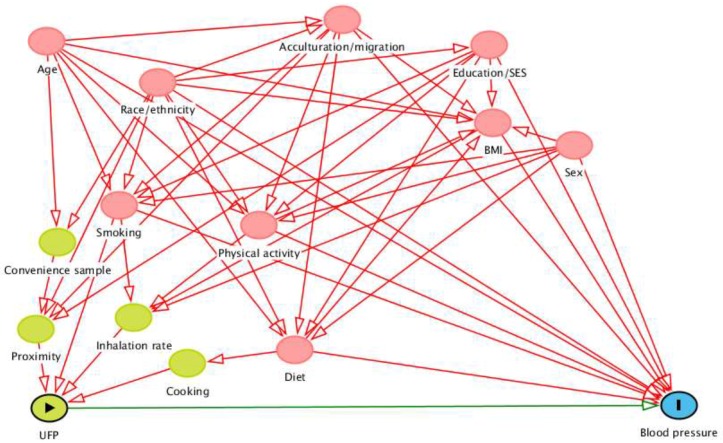
Figure 1.
Directed acyclic graph representing the relationships among the exposure (UFP; represented by the green oval with the triangle), outcome (blood pressure; represented by the blue oval with the line), and related factors. Variables represented as pink ovals are ancestors of exposure and outcome while variables represented as green ovals (convenience sample, proximity, inhalation rate, and cooking) are ancestors only of the exposure. Pink lines are biasing paths and the green line between the exposure and outcome is the causal path of interest.

