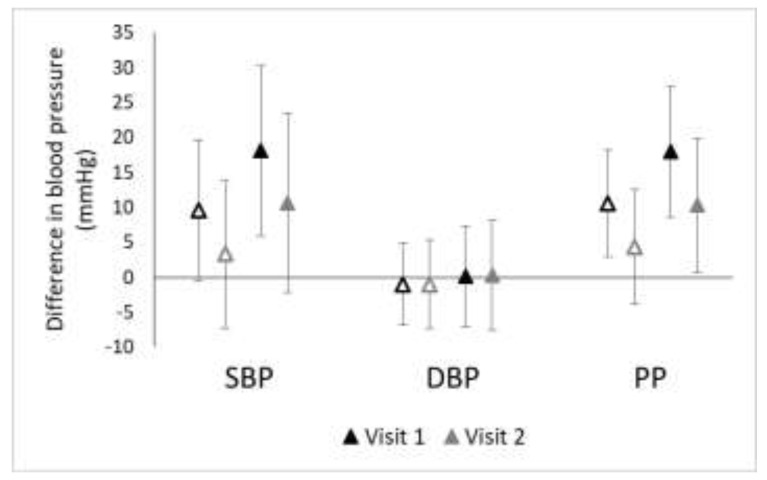
Figure 4.
Effect estimates for the association of ln(TAA-PNC) with blood pressure measures for participants in Somerville and Dorchester/South Boston who attended two clinic visits (n = 205). Open markers represent unadjusted associations (Model A) while solid markers represent adjusted associations (Model B; adjusted for BMI, sex, smoking, physical activity, and diet as fried food consumption).

