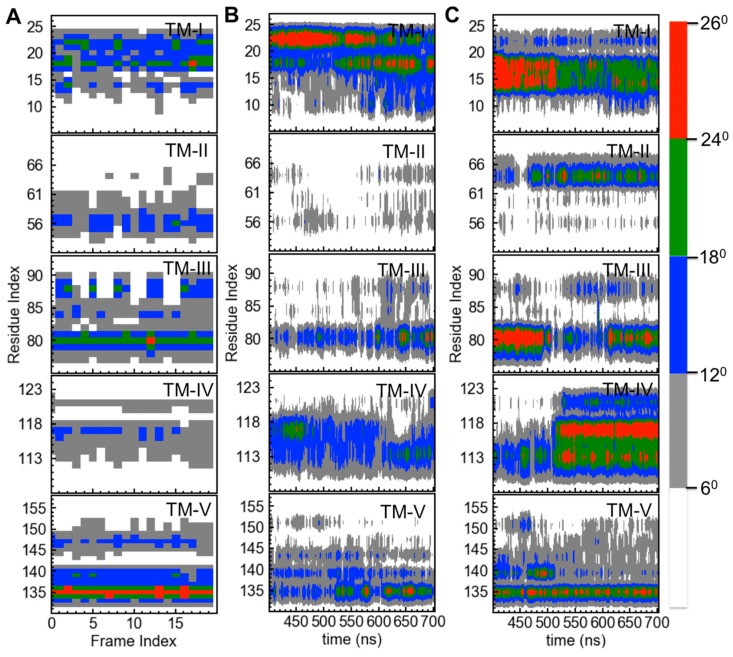
Figure 3.
The helix bending in mTSPO_NMR_monomer. The values are either reported for the deposited 20 NMR structures of mTSPO_NMR_monomer (PDBiD: 2MGY) (A), for mTSPO_NMR_monomer without (B) or with PK11195 (C) as a function of the simulation time. Only the last 300 ns are shown. The Figure was made using the “bendix” plugin of the VMD program [48].

