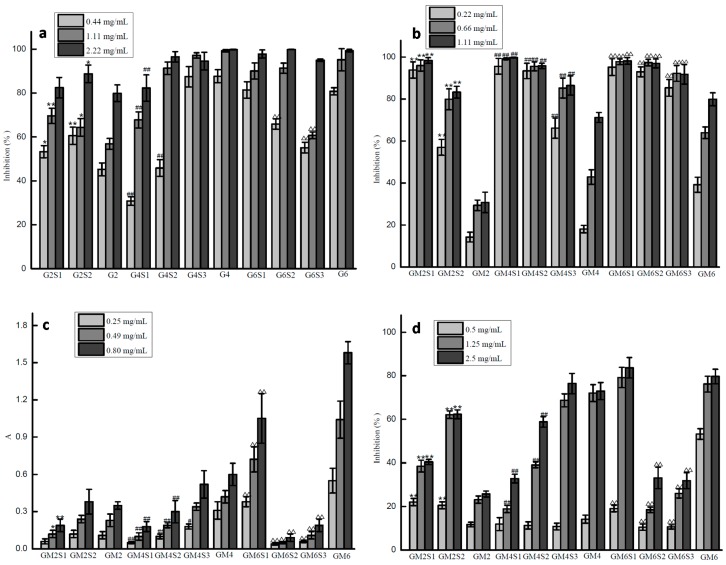
Figure 5.
The scavenging effects of different glucuronomannan oligosaccharides and their sulfated fractions on hydroxyl radical (a), superoxide radical (b), reducing power (c) and DPPH free radical (d). Values are expressed as the mean ± SD from three replicates. (* p < 0.05 compared to the G2; ** p < 0.01 compared to the G2; # p < 0.05 compared to the G4; ## p < 0.01 compared to the G4; Δ p < 0.05 compared to the G6; ΔΔ p < 0.01 compared to the G6).

