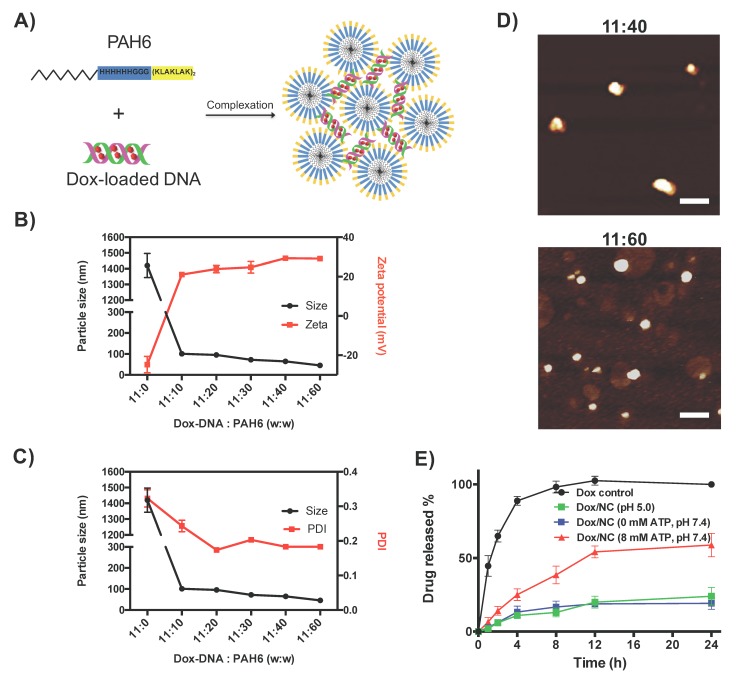
Figure 2.
(A) Schematic illustration of the mechanism for the formation of the Dox-DNA/PAH6 NC. (B) The averaged particle size and zeta potential of the Dox-DNA/PAH6 NC at different mass ratios of Dox-DNA and PAH6. Error bars represent SD (n = 3). (C) The averaged particle size and polydispersity index (PDI) of the Dox-DNA/PAH6 NC at different mass ratios of PAH6 and Dox-DNA. Error bars represent SD (n = 3). (D) AFM images of the Dox-DNA/PAH6 NC at the mass ratios of Dox-DNA to PAH6 of 11:40 and 11:60, respectively. The scale bar indicates 100 nm. (E) The Dox release profile of the Dox-DNA/PAH6 NC in the presence of 8 mM ATP. Error bars represent SD (n = 5).

