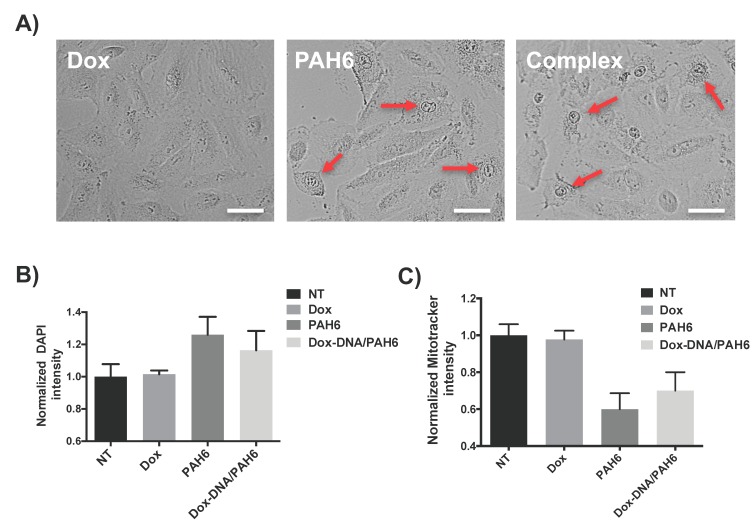
Figure 3.
(A) Optical micrographs showing the morphologies of the A549 cells after 30 min incubation with Dox (2 µg/mL), PAH6 (120 µg/mL), and the Dox-DNA/PAH6 (11:60) NC at corresponding concentrations. The scale bar indicates 40 µm. Arrows indicate the cells undergoing necrotic death. (B) The normalized fluorescence intensity of DAPI permeating into the cells after 30 min incubation with Dox (1 µg/mL), PAH6 (60 µg/mL), and the Dox-DNA/PAH6 (11:60) NC at corresponding concentrations. The DAPI fluorescence intensity of the nontreated (NT) cells is set as 1 for intensity normalization. Error bars represent SD (n = 3). (C) The normalized fluorescence intensity of MitoTracker Red that binds to the mitochondrial membranes of the cells after 1 h incubation with Dox (1 µg/mL), PAH6 (60 µg/mL), and the Dox-DNA/PAH6 (11:60) NC at corresponding concentrations. The MitoTracker Red fluorescence intensity of the nontreated (NT) cells is set as 1 for intensity normalization. Error bars represent SD (n = 3).

