Figure 2.
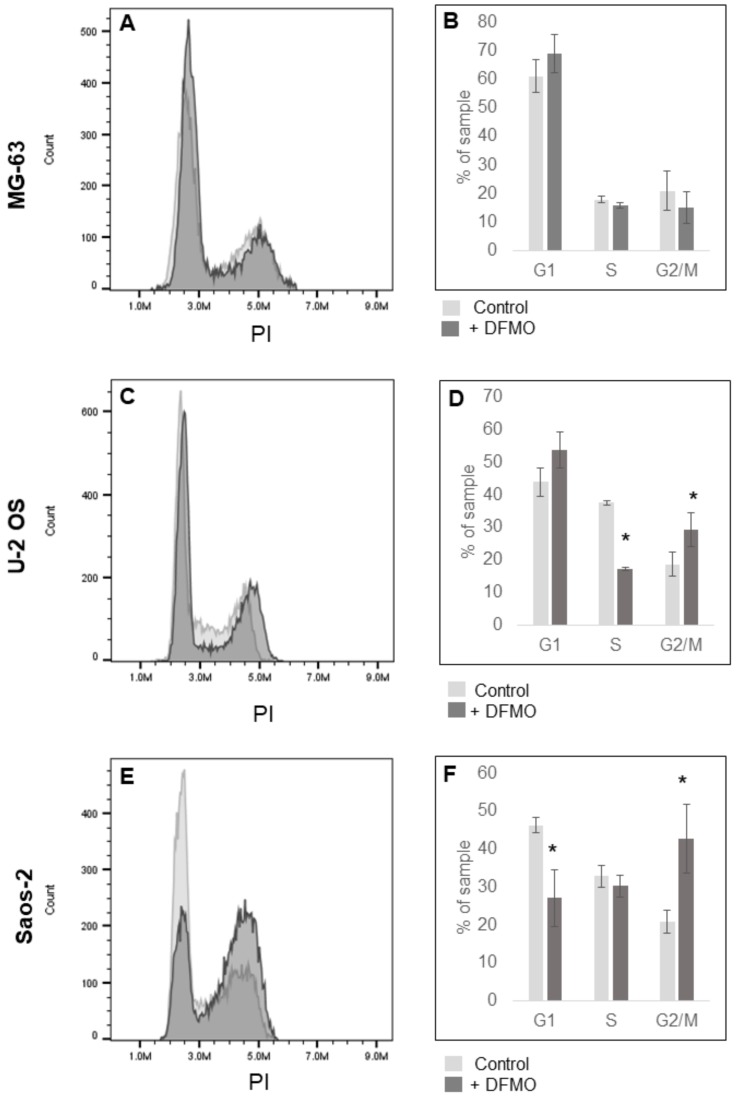
Effects of DFMO on cell cycle phase distribution in human OS cells. (A,C,E) Representative flow cytometry cell cycle analysis of MG-63, U-2 OS and Saos-2 cell lines stained with propidium iodide (PI) after 6 days of 5 mM DFMO exposure. Images are representative of three independent experiments (N = 3). (B,D,F) Percentage of cells in each phase of cell cycle averaged over at least three serial experiments (N = 3). U-2 OS and Saos-2 demonstrate G/2M cell cycle arrest after DFMO exposure. * denotes statistically significant changes in cell proliferation compared with control (p < 0.05).

