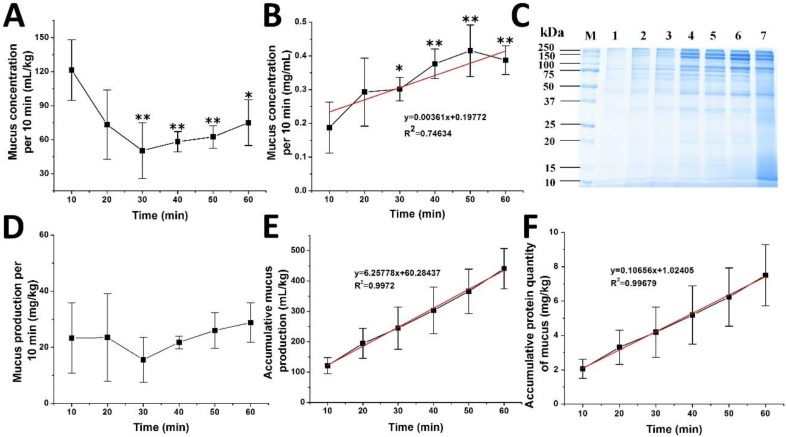
Figure 1.
Stress-induced mucus secretion and autolysis of A. coerulea. (A) Mucus volume of each sample/10 min; (B) Protein concentration of each sample/10 min was determined by the Bradford method; (C) SDS-PAGE of collected mucus and tissue homogenate of A. coerulea. M: protein molecular size marker; Lanes 1–6: mucus samples of A. coerulea collected in 60 min; Lane 7: jellyfish tissue homogenate; (D) Protein quantity (mg/kg)/10 min; (E) Accumulative volume of mucus (mL/kg)/60 min; (F) Accumulative protein quantity of mucus (mg/kg)/60 min. Mean ± SD (n = 4) is shown. * p < 0.05 and ** p < 0.01 indicate a significance difference as compared to the control.

