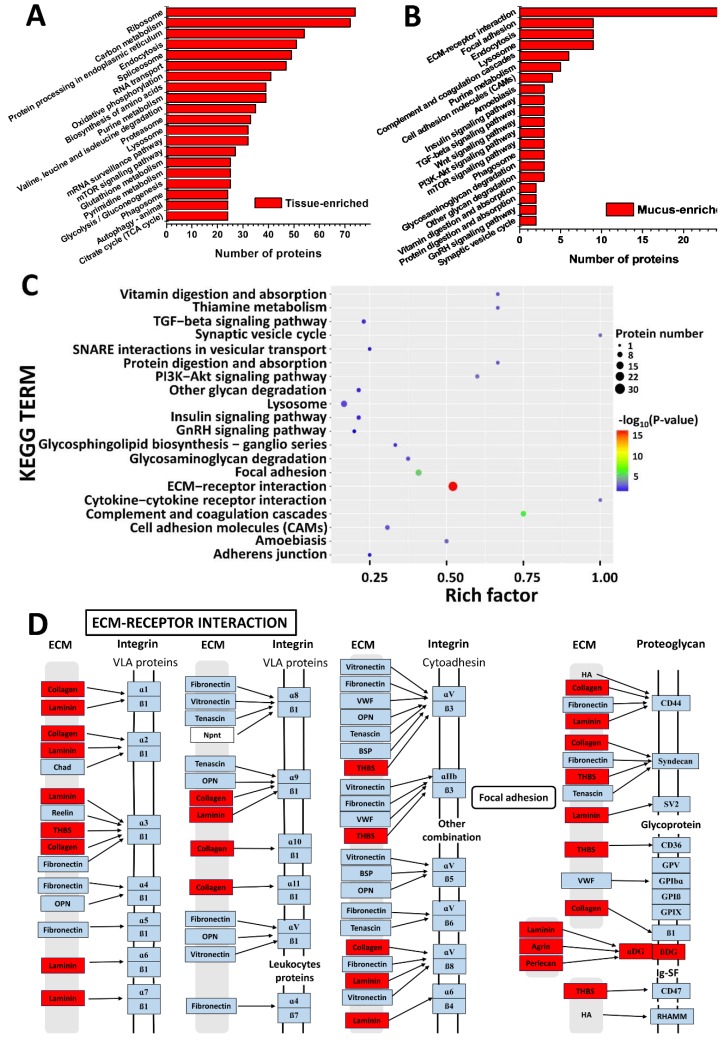
Figure 4.
Kyoto Encyclopedia of Genes and Genomes (KEGG) pathway annotation of identified proteins in tissue and mucus of A. coerulea. (A) KEGG pathway annotation of tissue-enriched proteins. The horizontal axis is the number of proteins, whereas the vertical ordinates are the terms of the KEGG pathways. (B) KEGG pathway annotation of mucus-enriched proteins. (C) KEGG pathway enrichment of mucus-enriched proteins. The horizontal axis indicates rich factor and vertical ordinates are the terms of the KEGG pathways. Rich factor is the proportion of the number of differentially expressed proteins vs. the total number of proteins in the same KEGG pathway. The bubble shows the number of proteins matched in the KEGG pathway. The color represents −log10(p value): Logarithmic conversion of Fisher exact test p value. (D) The ‘ECM-receptor interaction’ pathway matched from the KEGG PATHWAY database where the elevated proteins from mucus-enriched proteins are colored by red.

