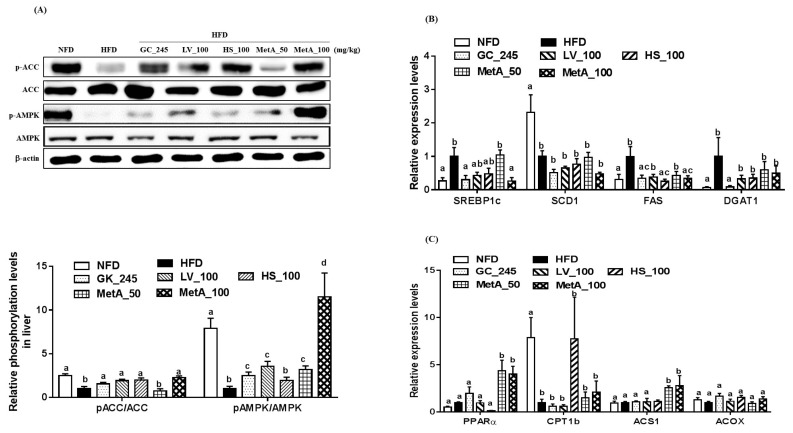
Figure 8.
Effects of LV, HS, and MetA on ACC and AMP-activated kinase (AMPK) phosphorylation in liver tissue of obese mice fed HFD. Quantification of proteins in immunoblot (A). A representative blot is shown (A, upper), Densitometric analyses of p-ACC and ACC, and p-AMPK and AMPK (A, lower) in liver. Relative signal strength of AMPK, p-AMPK, ACC, p-ACC, and internal control (β-actin) was quantified for each band and the relative expression levels of quantification of proteins were calculated as a ratio to HFD-HFD gene expression. mRNA expression levels of lipogenesis (B) and fatty acid oxidation (C)-related genes were analyzed using qPCR. HFD, 60% high-fat-diet control group; HFD + GC_245, HFD contains Garcinia cambogia extract (245 mg/kg)-fed group; HFD + LV_100, HFD contains lemon verbena extract (100 mg/kg)-fed group; HFD + HS_100, HFD contains Hibiscus flower extract (100 mg/kg)-fed group; HFD + MetA_50, HFD contains the MetA-mixed extract of lemon verbena plus Hibiscus flower (50 mg/kg)-fed group; HFD + MetA_100, HFD contains the MetA-mixed extract of lemon verbena plus Hibiscus flower (100 mg/kg)-fed group. Values are expressed as means ± SEM (n = 10). a–d Values within arrow with different letters are significantly different from each other at p < 0.05 as determined using Turkey’s multiple-range test.

