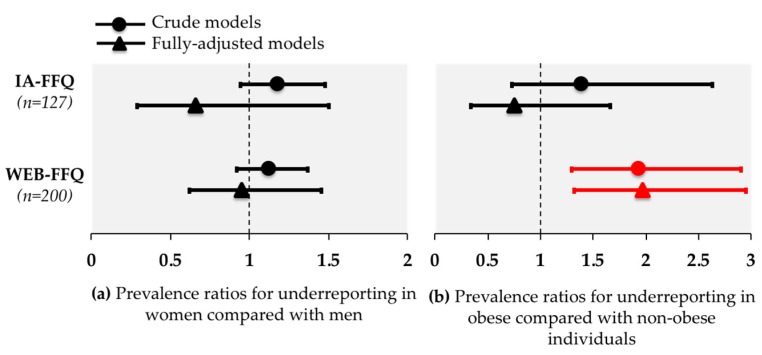
Figure 2.
Log-binomial regression analysis showing prevalence ratios with 95% CI for under-reporting in: (a) women vs. men and; (b) in obese vs. non-obese individuals. Crude models are shown with circles and adjusted models are shown with triangles. Under-reporters are individuals of which their corresponding rEI:mER ratio is below 0.79. CI: confidence interval; FFQ: food frequency questionnaire; IA: interviewer-administered.

