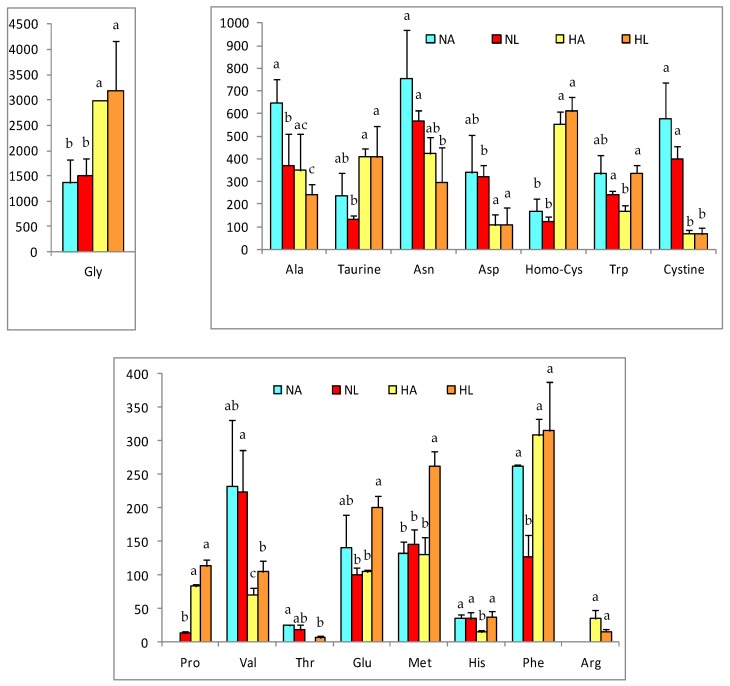
Figure 2.
Relevant amino acids concentrations in liver of rats of the four experimental groups (NA: normal diet and water, NL: normal diet and tomato juice as drink, HA: hypercholesterolemic and high-fat diet and water, HL: hypercholesterolemic and high-fat diet and tomato juice). Concentration values are given in nmol/g, as mean ± SD. a–c Different letters indicate a statistically significant difference (p < 0.05).

