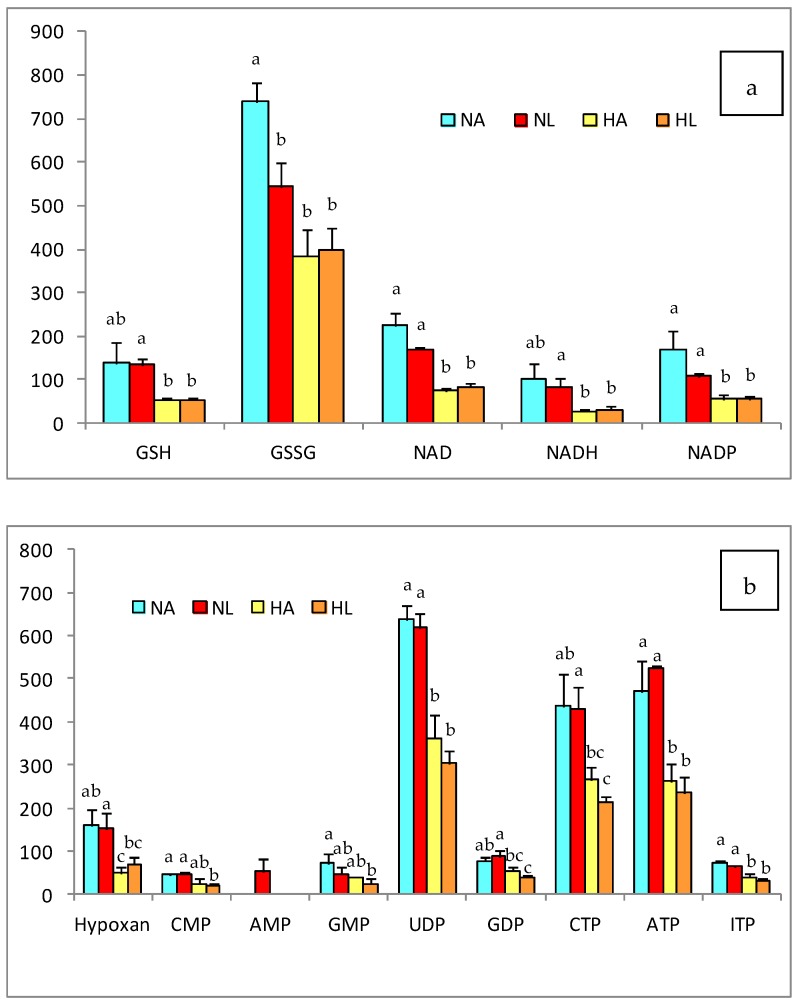
Figure 3.
(a) Antioxidant and (b) nuleotide compounds in the liver of rats of the four experimental groups (NA: normal diet and water, NL: normal diet and tomato juice as drink, HA: hypercholesterolemic and high-fat diet and water, HL: hypercholesterolemic and high-fat diet and tomato juice). The bar height indicates the mean value for each group and the error bar indicates the standard deviation. a–c Diferent letters indicate a statistically significant difference (p < 0.05).

