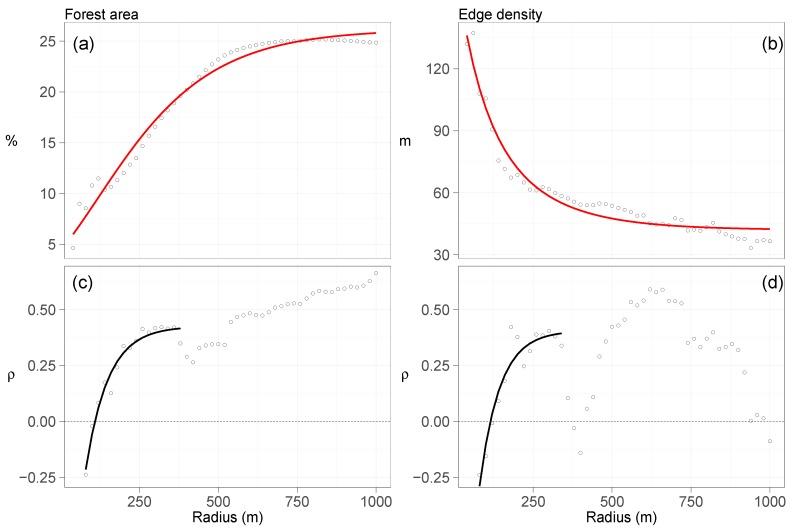
Figure 4.
Forest area, edge density, and their Spearman correlation coefficients () with SWD at distances from 80–1000 m in 20 m intervals. Fitted red lines in (a,b) represent results from Gompertz functions (Equation (2)). The black lines in (c,d) are results from limited growth models (Equation (3)).

