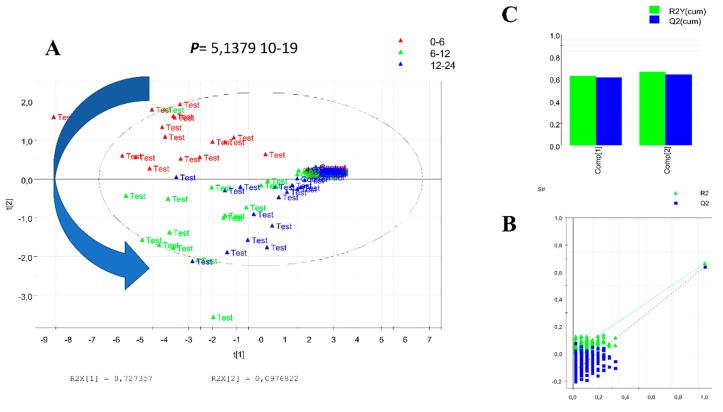
Figure 5.
PLS-DA analysis of nine of the most discriminant features in two conditions. (A) PLS-DA model among control and test shows very significant (1.64587 × 10⁻²²) difference between classes. (B) Permutation test, method validation R2 = (0.0, 0.00525), and Q2 = (0.0, −0.13). (C) Two groups’ PLS-DA score and the predictive model cutoff.

