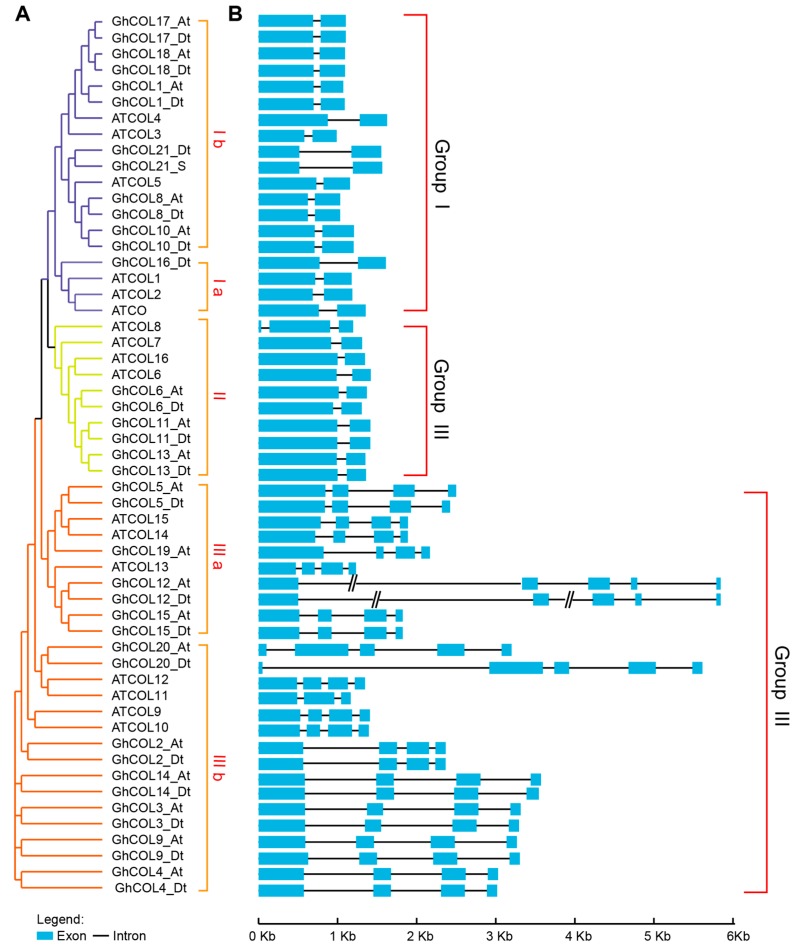
Figure 4.
Comparison of the gene structures between G. hirsutum and A. thaliana. An NJ tree based on the relationship between A. thaliana and G. hirsutum (A); and the number, position, and length of exons and introns within CO-like genes (B). Purple, green, and orange in (A) represent Group I–III, respectively. Boxes and black lines in (B) indicate the exons and introns, respectively.

