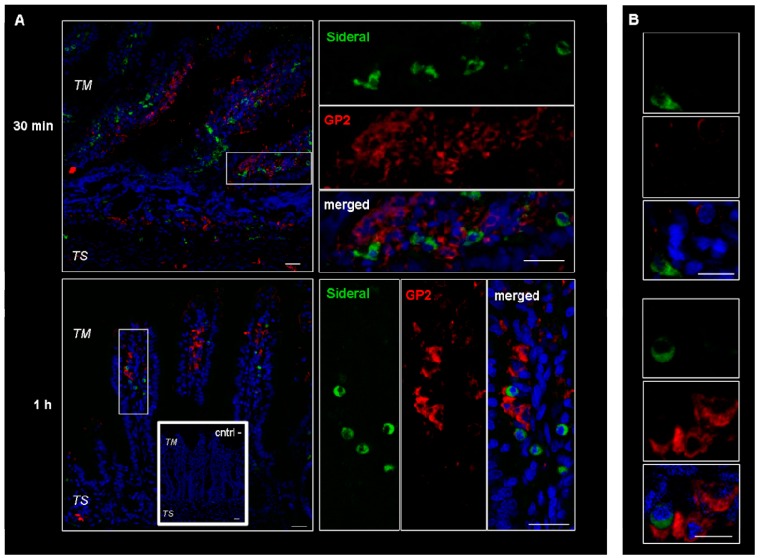
Figure 4.
Confocal laser scanning microscopy: representative images of rat gut sections after 0.5 and 1 h incubation in Ussing chamber. Negative controls obtained omitting primary antibodies are shown in double line squares. Individual fluorescent channels: green (SRM), red (GP2 + cells) and blue (nuclei). (A) bidimensional image of the maximum intensity projection. Scale bar 25 µm. (B) Images acquired in one Z-plane (38th of 59, 22nd of 64, incubated 0.5 h and 1 h, respectively) at a higher magnification. Scale bar 10 µm.

