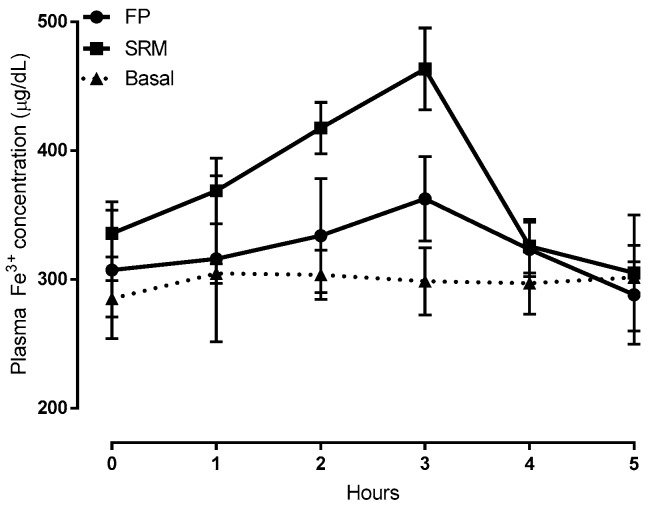
Figure 5.
Plasma Fe3+ concentration vs time plots following administration of 400 μL of a suspension (5 mg/kg of iron) of SRM and ferric pyrophosphate salt (FP, ferric pyrophosphate salt) (control) compared to Fe3+ concentration in untreated animals (basal). Means ± SD of at least six values obtained with different animals.

