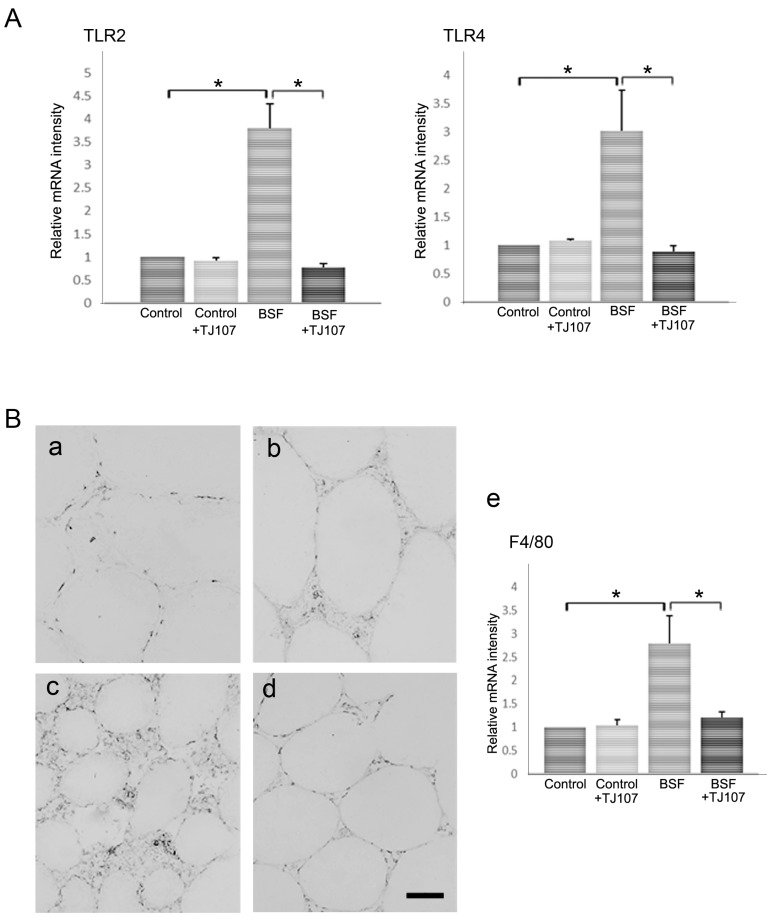
Figure 5.
TLR expression and macrophage migration at day 120 in each group. A: Expressions of TLR2 and TLR4 in testicular tissues of mice from each group (n = 10). Asterisks indicate p < 0.05. B: F4/80 antigen-positive cells in testicular sections (n = 10) of mice from the control (a), control+TJ107 (b), BSF (c), and BSF+TJ107 (d) groups. Many macrophages are seen infiltrating the interstitium around the atrophic seminiferous tubules in the BSF group (c). Bar = 20 µm. (e) Expression of the macrophage marker gene in testicular tissues of mice from each group (n = 10). Asterisks indicate p < 0.05.

