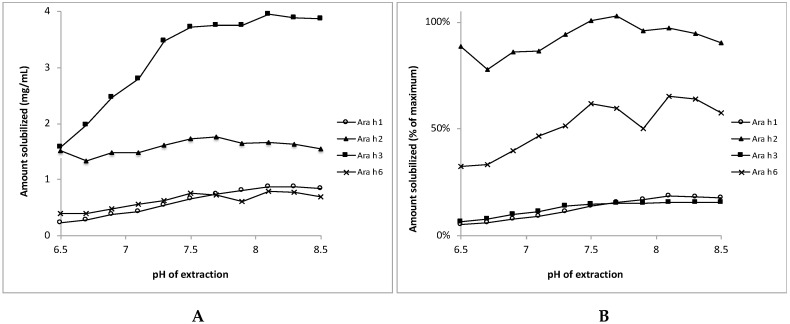
Figure 5.
Release of individual peanut allergens from their matrix of light roasted peanut flour dissolved at various pHs mimicking saliva. Panel A: Protein concentrations in the supernatants, in mg/mL. Panel B: Protein concentrations in the supernatants expressed as percentage of the theoretical maximum value. Mean values of two experiments are shown (SDs were typically between 0 and 8% of the mean (except in one case were the SD was 13% of the values; for Ara h6 at pH = 7.9). SDs are not shown here to improve readability.

