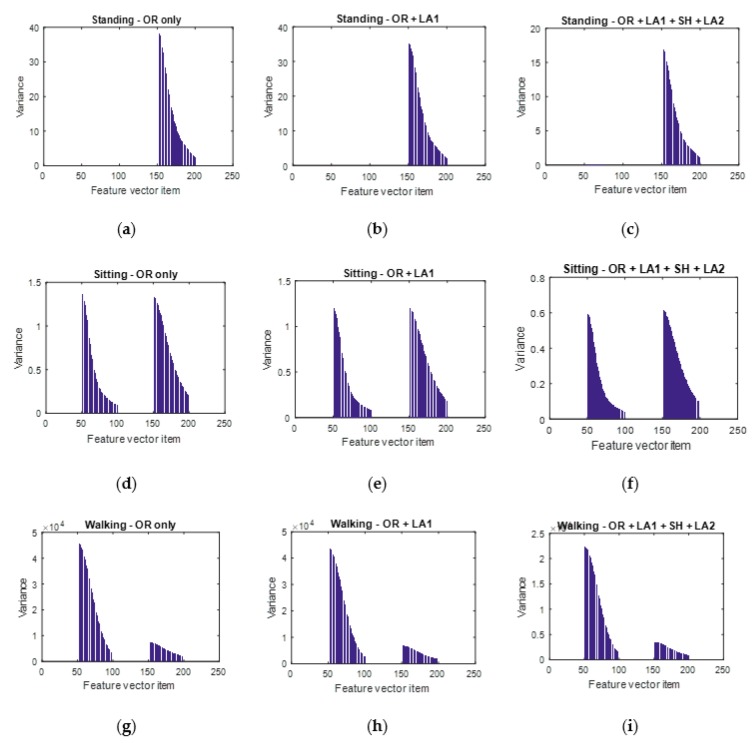
Figure 12.
Visualizing the variance of data to check the influence of each data augmentation block. (a,b,c) represent the variance of the unaugmented dataset, augmented dataset after the first local averaging and that of the augmented dataset after the first local averaging, shuffling and the second local averaging procedure respectively for the standing activity. (d,e,(f) represent the variance of the unaugmented dataset, augmented dataset after the first local averaging and that of the augmented dataset after the first local averaging, shuffling and the second local averaging procedure respectively for the sitting activity. (g,h,i) represent the variance of the unaugmented dataset, augmented dataset after the first local averaging and that of the augmented dataset after the first local averaging, shuffling and the second local averaging procedure respectively for the walking activity.

