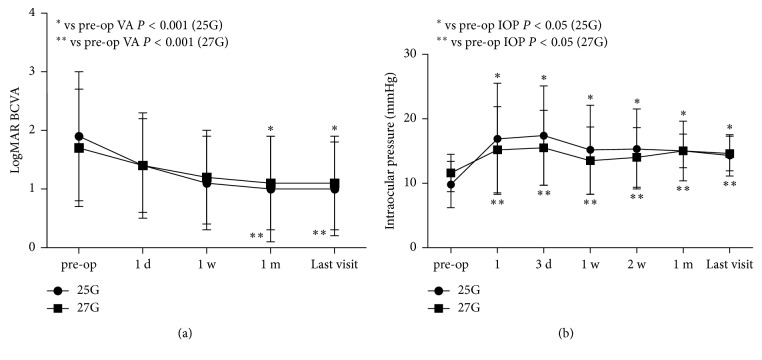
Figure 2.
Time course of logMAR BCVA and IOP. (a) The mean logMAR BCVA at preoperative, postoperative day 1, week 1, month 1, and last visit was 1.9 ± 1.1, 1.4 ± 0.9, 1.1 ± 0.8, 1.0 ± 0.9, and 1.0 ± 0.8 in the 25G group, and 1.7 ± 1.0, 1.4 ± 0.8, 1.2 ± 0.8, 1.1 ± 0.8, and 1.1 ± 0.8 in the 27G group. When compared with the preoperative BCVA, postoperative BCVA at 1 month and the last visit increased significantly in both groups (P < 0.001). BCVA, best-corrected visual acuity, logMAR, logarithm of the minimal angle; (b) The mean IOP at baseline was 9.8 ± 3.6 mmHg in the 25G group and 11.6 ± 2.9 mmHg in the 27G group. At postoperative1 day, 3 day, 1 week, 2 weeks, 1 month, and last visit, IOP was 16.9 ± 8.6, 17.4 ± 7.7, 15.2 ± 6.9, 15.3 ± 6.2, 15.0 ± 4.6, and 14.3 ± 3.2 mmHg, in the 25G group, and 15.2 ± 6.7, 15.5 ± 5.8, 13.5 ±5.2, 14.0 ± 4.6, 15.0 ± 2.6, and 14.6 ± 2.7 mmHg in the 27G group. No significant differences in IOP between the two groups were observed during the follow-up. However, When compared with the preoperative IOP, postoperative IOP was significantly higher at each time point (P < 0.05) in both the 25G and 27G groups; IOP, intraocular pressure.

