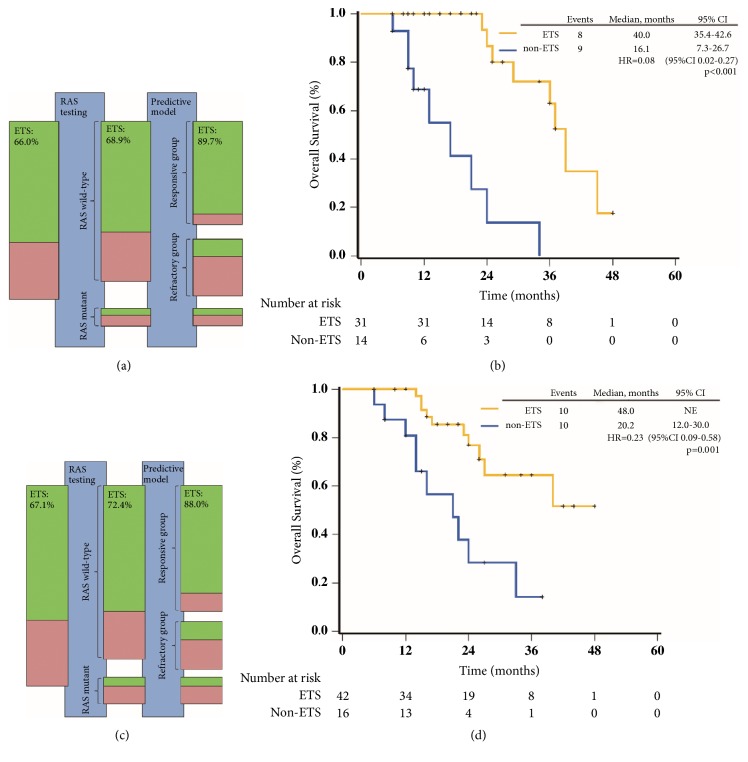
Figure 3.
Predictive model and ETS. (a) The improvement of ETS rate of patients receiving cetuximab plus chemotherapy in training cohort was gained by RAS testing and predictive model. The green bars represent responders (CR + PR); the red bars nonresponders (SD + PD). The size of the bars is in agreement with the corresponding numbers of patients. (b) Kaplan-Meier curve for OS of patients receiving cetuximab plus chemotherapy in training cohort according to ETS. (c) The improvement of ETS rate of patients receiving cetuximab plus chemotherapy in validation cohort was gained by RAS testing and predictive model. (d) Kaplan-Meier curve for OS of patients receiving cetuximab plus chemotherapy in validation cohort according to ETS. ETS was defined as a ⩾20% reduction of the longest diameters of measurable liver metastases in eight weeks compared with baseline at the first evaluation. ETS, early tumor shrink. PFS, progression-free survival. OS, overall survival.

