. 2018 Sep 18;18(9):3152. doi: 10.3390/s18093152

Table 1.

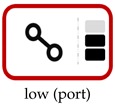
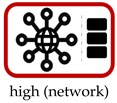
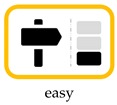
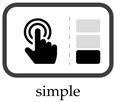
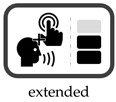
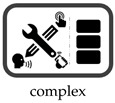
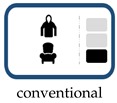
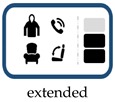
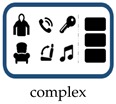
Visualization of all attribute levels. A decision task consists of one level form each attribute. Each participant performed 7 choice tasks.

Attributes Levels
Connectivity graphic file with name sensors-18-03152-i001.jpg graphic file with name sensors-18-03152-i002.jpg graphic file with name sensors-18-03152-i003.jpg
Usability graphic file with name sensors-18-03152-i004.jpg graphic file with name sensors-18-03152-i005.jpg graphic file with name sensors-18-03152-i006.jpg
Ease of Cleaning graphic file with name sensors-18-03152-i007.jpg graphic file with name sensors-18-03152-i008.jpg graphic file with name sensors-18-03152-i009.jpg
Input Modality graphic file with name sensors-18-03152-i010.jpg graphic file with name sensors-18-03152-i011.jpg graphic file with name sensors-18-03152-i012.jpg
Feature Range graphic file with name sensors-18-03152-i013.jpg graphic file with name sensors-18-03152-i014.jpg graphic file with name sensors-18-03152-i015.jpg