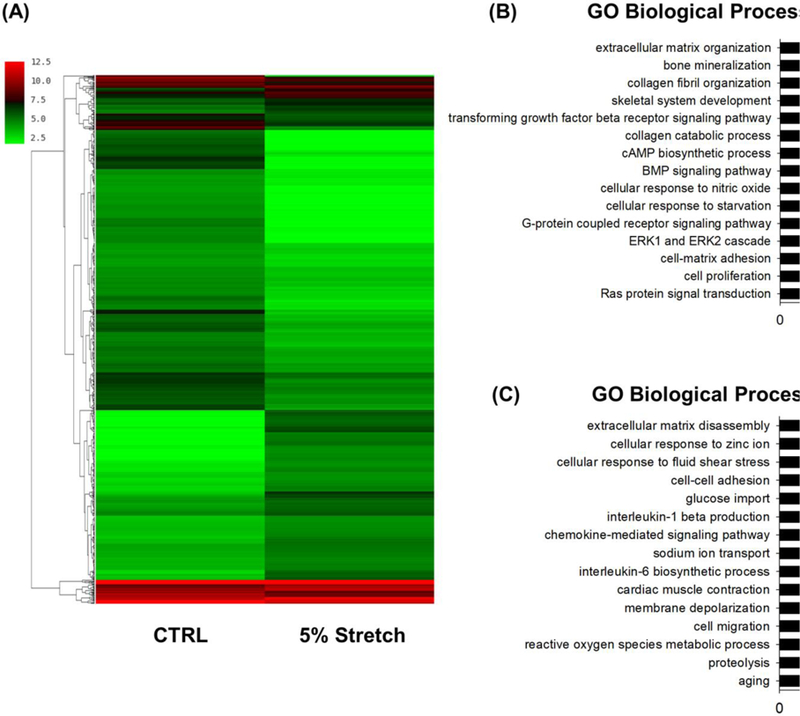
Figure 2.

Global gene expression profile of stretch-treated and static BM-MSCs. Cells were exposed to cyclic stretch of 5% for 3 days and gene expression was analyzed by cDNA microarray. Cells cultured under static conditions served as the control (CTRL). (A) The differently expressed genes in BM-MSCs in response to mechanical stretch are illustrated as a heat map. The color bars on the left of the heat map indicate gene expression level, with redder being higher and greener being lower. (B) GO analysis of the up-regulated gene clusters in stretch-treated BM-MSCs compared with static cells.GO analysis of the down-regulated gene clusters in stretch-treated BM-MSCs compared with static cells.
