
Figure 3:
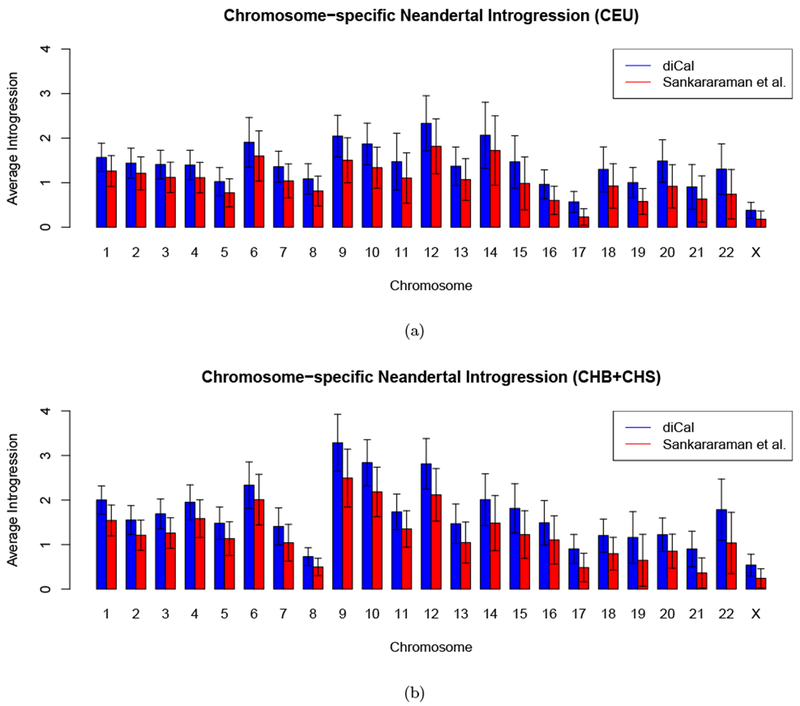
The amount of Neanderthal introgression in modern-day individuals, stratified by chromosome. The height of each bar gives the average introgression, and the whiskers indicate the standard deviation across the sample. (a) CEU. (b) CHB+CHS.
Official websites use .gov
A
.gov website belongs to an official
government organization in the United States.
Secure .gov websites use HTTPS
A lock (
) or https:// means you've safely
connected to the .gov website. Share sensitive
information only on official, secure websites.
The amount of Neanderthal introgression in modern-day individuals, stratified by chromosome. The height of each bar gives the average introgression, and the whiskers indicate the standard deviation across the sample. (a) CEU. (b) CHB+CHS.