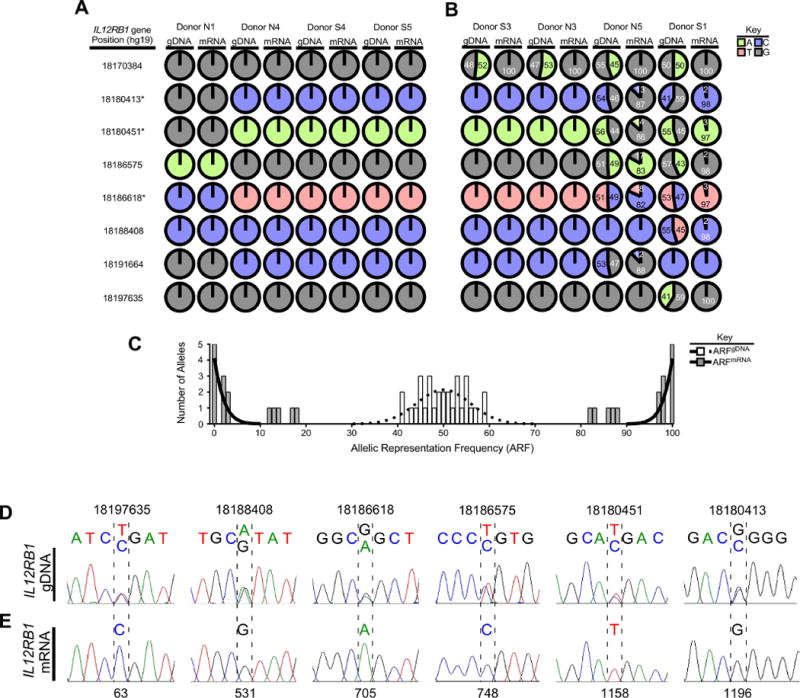
FIGURE 1.

IL12RB1 expression in human lung tissue is allele-biased. (A-C) IL12RB1 gDNA and mRNA from 8 lung tissue donors (N1, N4, S4, S5, S3, N3, N5, S1) was sequenced via Ion Torrent. For each donor, the IL12RB1 gDNA sequence was queried at 11 polymorphic sites (18170384, 18170755, 18180413, 18180451, 18186575, 18186618, 18188408, 18191664, 18192977, 18194255 and 18197635) to determine if they were homozygous (i.e. only 1 nt was read at that site) or heterozygous (i.e. 2 nts were read at that site). The data from each donor are represented by pie charts indicating the nts detected at each site (G, gray; T, red; A, green; C, blue) and their relative representation among all reads of that site. We similarly queried and analyzed IL12RB1 mRNA sequence data from the same tissue specimens. Shown are (A) IL12RB1 gDNA and mRNA sequence data from four donors (N1, N4, S4 and S5) who were homozygous at all 11 polymorphic sites, as well as (B-C) IL12RB1 gDNA and mRNA sequence data from four donors (S3, N3, N5 and S1) who were heterozygous at ≥1 polymorphic sites. The numbers in each chart indicate the frequency with which the indicated allele was represented among all reads of that site (i.e. the allele read frequency, or ARF). The asterisks next to IL12RB1 gene positions 18186618/18180451/18180413 indicate the linked SNPs that comprise the “RTR haplotype” and “QMG haplotype”4, 46. (C) A histogram depicting the distribution of gDNA ARF values of each heterozygous allele (open bars), and the mRNA ARF values of the same alleles (closed bars). Nonlinear regression analysis was used to test the Gaussian distribution of the gDNA ARF values, and is depicted by a dotted regression line (r2=0.7, mean=50.0); mRNA ARF values were bifurcated and non-Gaussian (solid regression line). (D) Donor S1 lung gDNA was amplified with primers flanking 6 polymorphic sites in the IL12RB1 gene (18180413, 18180451, 18186575, 18186618, 18188408, and 18197635); amplicons were Sanger sequenced. Shown are representative Sanger traces demonstrating 2 nts at gDNA positions 18197635 (T/C), 18188408 (A/G), 18186618 (G/A), 18186575 (T/C), 18180451 (T/C), and 18180413 (G/C). (E) mRNA from the same specimen was used to make an IL12RB1 cDNA library, of which 10 clones were randomly chosen for Sanger sequencing. Shown are the Sanger traces of regions that correspond to nts transcribed from the gDNA alleles shown in (D). Indicated by hatched lines are the cDNA nt positions (63, 531, 705, 748, 1158 and 1196) that correspond to the above polymorphic gDNA positions. In contrast to the gDNA traces, there is only 1 nt present at each cDNA position, representing the gDNA allele from which that mRNA was originally transcribed. All 10 cDNA clones contained the same nt at positions 63 (C), 531 (G), 705 (A), 748 (C), 1158 (T) and 1196 (G).
