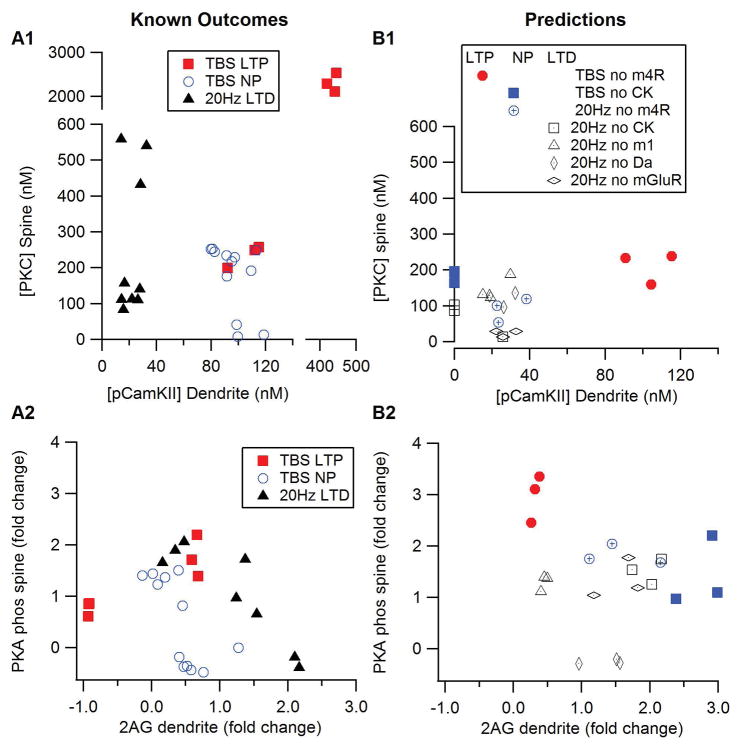
Figure 5.
Mean molecule concentration measured 60s after stimulation onset illustrates plasticity outcome predicted by discriminant analysis. (A1, B1) PKC in the spine versus phosphoCamKII (pCamKII) in the dendrite. (A2, B2) PKA phosphorylated proteins in the spine versus 2AG in the dendrite. (A) Prediction of the discriminant analysis for conditions for which experimental outcomes are known. (B) Predictions of the discriminant analysis for which experimental outcomes are unknown. For all panels, red symbols indicate outcome of LTP, blue symbols indicate no plasticity and black symbols indicate LTD.

