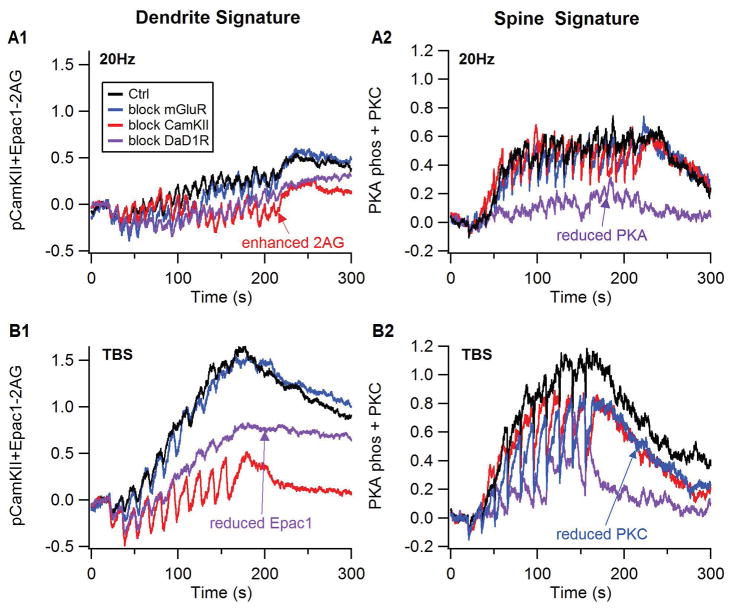
Figure 6.
Plasticity signatures illustrate how blocking receptors or kinases blocks plasticity. Plasticity signatures were created based on the discriminant analysis result. Thus, the spine signature (right column) is the normalized sum of PKC activity and PKA phosphorylated proteins in the spine, and the dendrite signature (left column) is the normalized sum of Epac1 and phosphorylated CamKII minus 2AG. (A) response to 20 Hz stimulation, (B) response to theta burst stimulation. The effect of antagonists is to reduce either the dendrite or spine signature compared to control, both for theta burst and 20 Hz stimulation protocols.

