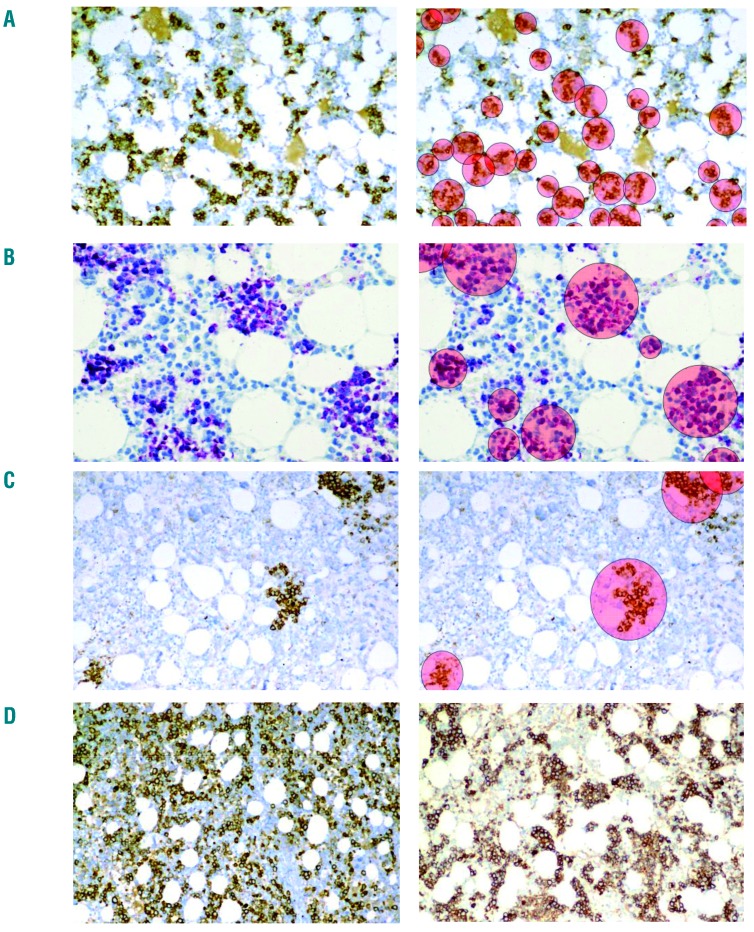
Figure 3.
Structure and size of erythroid islands in the bone marrow. (A) Erythroid islands in the bone marrow of a 16-year old healthy male visualized by staining for CD71. (B) Erythroid islands in the bone marrow of an 82-year old female without bone marrow neoplasm. Erythroid islands were visualized by staining against hemoglobin A. Note the decreased number and increased size of erythroid islands in the bone marrow of the older healthy control. (C) Erythroid islands in the bone marrow of a 73-year old male patient with myelodysplastic syndrome with excess of blasts (5–9% of marrow cells, MDS-EB-1) visualized by staining for CD71. In the right images of 3A, 3B and 3C, erythroid islands are evidenced by pink circles. Note the decreased number of erythroid islands in this patient. (D, left panel) Bone marrow section of a 78-year old male with myelodysplastic syndrome with excess of blasts (10–19% of marrow cells, MDS-EB-2) stained for CD71. In this patient, numerous confluent, partially disrupted and poorly separable erythroblastic islands are seen. (D, right panel) Bone marrow section of an adult patient with hemolytic anemia. Note that erythroid islands are increased, but are clearly separable and have a regular shape (contrasting with MDS). Original magnifications: A, C, D: × 125; B: × 250.

