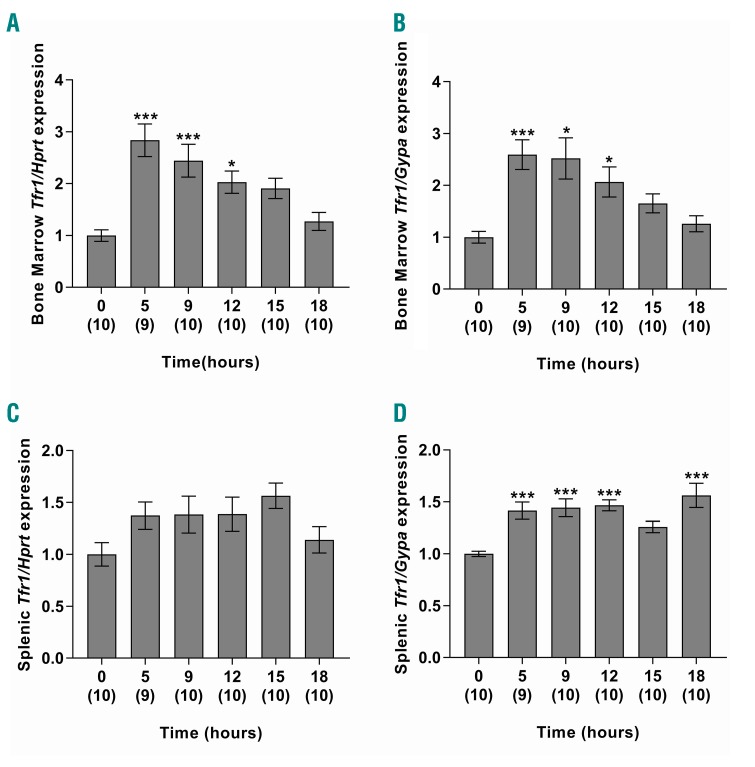
Figure 2.
Tfr1 expression following erythropoietin injection in mice. Six-week old male C57BL/6 mice were euthanized 0, 5, 9, 12, 15 or 18 h following the intravenous injection of 10 U/g body weight human erythropoietin and tissues were taken for analysis. Bone marrow Tfr1 expression (A, B) and splenic Tfr1 expression (C, D) were determined for each time point. Gene expression levels were calculated relative to either the general housekeeping gene Hprt or the erythroid-specific marker Gypa, and are expressed as a proportion of the values at 0 h. The data represent the mean ± SEM with the number of mice in each group indicated in parentheses along the x-axis. Statistical significance is shown relative to the 0 h group. *P<0.05; ***P<0.005.

