Figure 3.
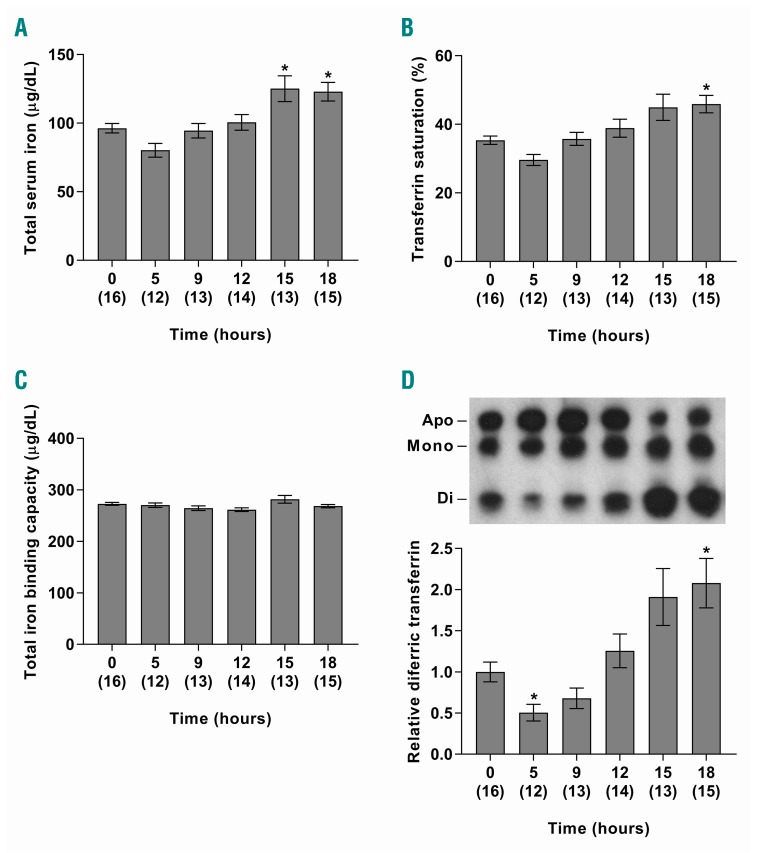
Circulating iron parameters following erythropoietin injection in mice. Six-week old male C57BL/6 mice were euthanized 0, 5, 9, 12, 15 or 18 h following the intravenous injection of 10 U/g body weight human erythropoietin and blood was taken for analysis. Total serum iron (A), transferrin saturation (B), total iron binding capacity (C) and relative diferric transferrin levels (D) were determined for each time point. The relative diferric transferrin levels represent the percentage of transferrin in the diferric form expressed as a proportion of the values at 0 h. The data represent the mean ± SEM with the number of mice in each group indicated in parentheses along the x-axis. Apo: apotransferrin; Mono: monoferric transferrin; Di: diferric transferrin. Statistical significance is shown relative to the 0 h group. *P<0.05.

