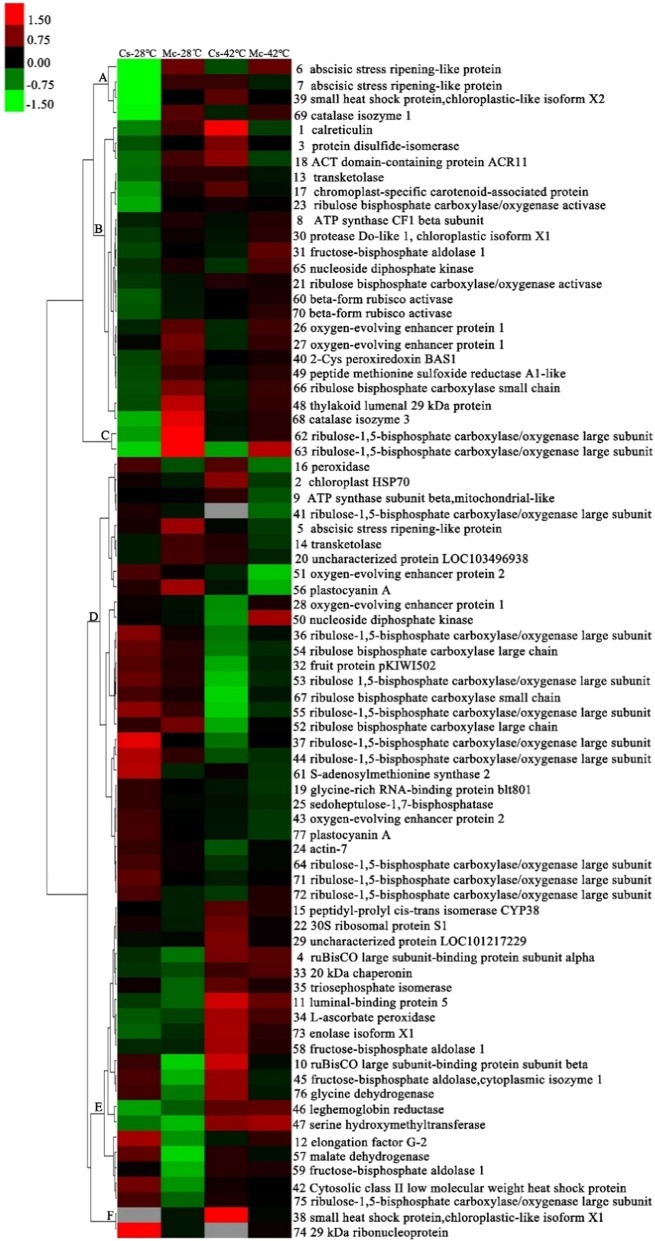
Fig. 5. Hierarchical clustering analysis of differentially accumulated proteins responding to Momordica rootstock and/or high temperature.
Fold changes of protein abundance among four treatments were log2 transformed and delivered to Cluster and Treeview software. Each row represents individual protein spots and spot numbers, and protein names are labeled at right of corresponding heat maps. Red and green show higher and lower expression levels, respectively

