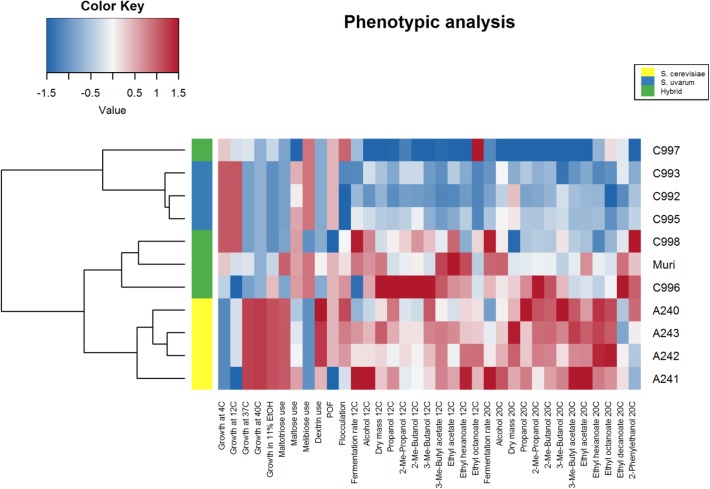
FIGURE 3.
Heat map of 35 brewing-relevant phenotypic traits in S. cerevisiae, S. uvarum, and natural hybrid strains. The heat map was generated based on the z-scores (blue and red indicate low and high values, respectively). Strains were clustered using hierarchical clustering with optimal leaf ordering.

