
FIGURE 2.
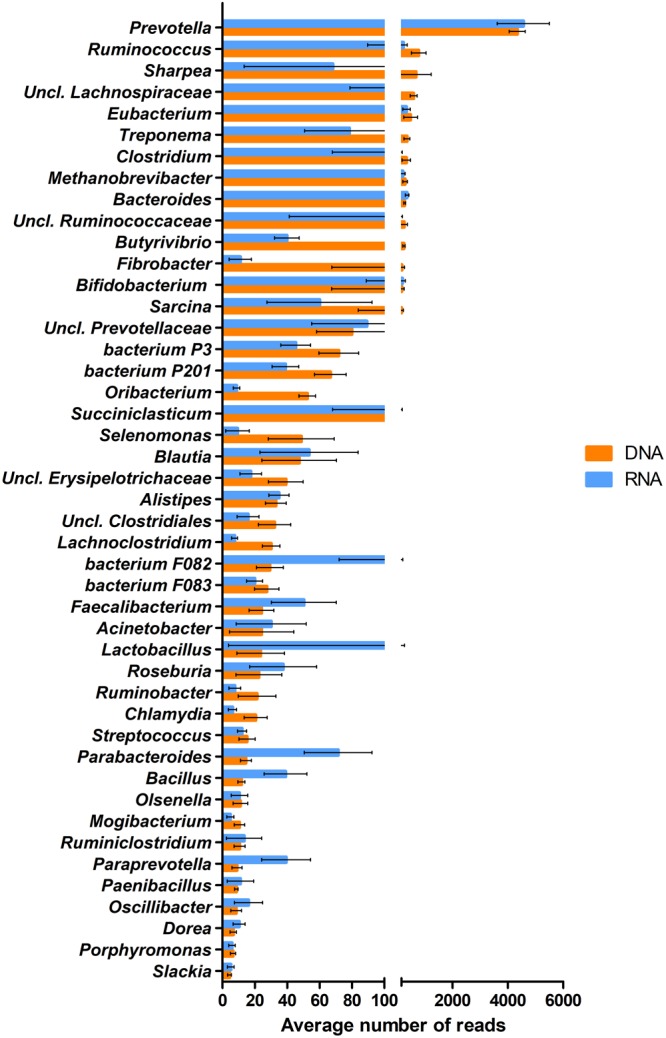
The abundance distribution of the 48 genera comprising the core microbiota calculated from the average DNA-based metagenome and RNA-based metatranscriptome datasets. Error bars indicate the variances among the individual 10 rumen samples.
Official websites use .gov
A
.gov website belongs to an official
government organization in the United States.
Secure .gov websites use HTTPS
A lock (
) or https:// means you've safely
connected to the .gov website. Share sensitive
information only on official, secure websites.
The abundance distribution of the 48 genera comprising the core microbiota calculated from the average DNA-based metagenome and RNA-based metatranscriptome datasets. Error bars indicate the variances among the individual 10 rumen samples.