
FIGURE 4.
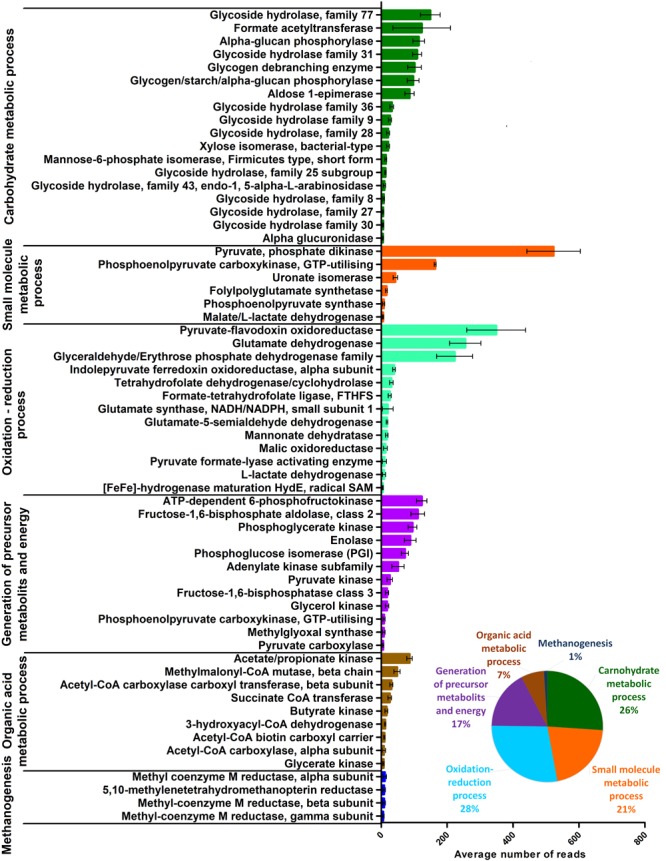
The distribution of the core microbial functions calculated from the average RNA-based metatranscriptome dataset. Error bars indicate the variances among the individual 10 rumen samples. The inset indicates the relative partition of the functional groups within the metatranscriptome.