
Figure 1.
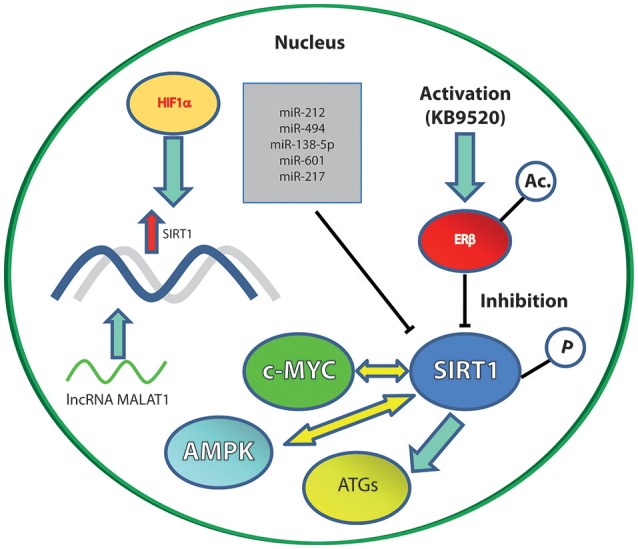
The main SIRT1 molecular interactors (inhibitory or activatory) cited in the text. Solid blue arrows represent an activation; yellow arrows represent an interplay; blunt ended black lines represent an inhibition; red arrow represents upregulation of gene expression.